
FIGURE 6.
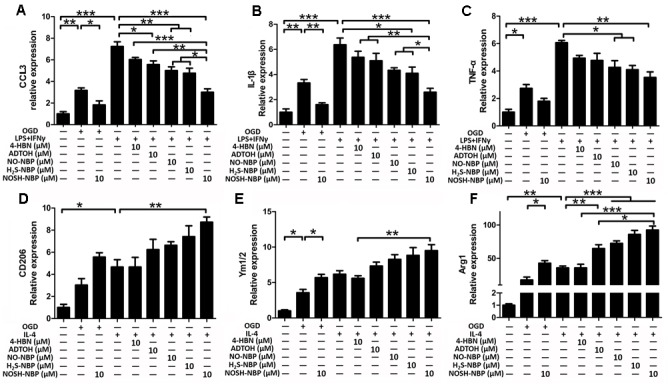
Effect of ADTOH, 4-HBN, NO-NBP, H2S-NBP, and NOSH-NBP on microglial M1/M2 polarization in vitro. BV2 microglia were treated with OGD, LPS (100 ng/mL) + IFN-γ (20 ng/mL), IL-4 (20 ng/mL), NO-NBP (10 μM), H2S-NBP (10 μM), ADTOH (10 μM), 4-HBN (10 μM), NOSH-NBP (10 μM) or a combination of these treatments. Quantitative analysis of mRNA expression levels of the M1 markers (A) CCL3, (B) IL-1β, and (C) TNF-α (n = 6). Quantitative analysis of mRNA expression levels of the M2 markers (D) CD206, (E) Ym1/2, and (F) Arg1 (n = 6). Data are expressed as the mean ± SD and were analyzed by one-way ANOVA followed by post hoc Tukey test: ∗∗∗P < 0.001, ∗∗P < 0.01, ∗P < 0.05.