
FIGURE 9.
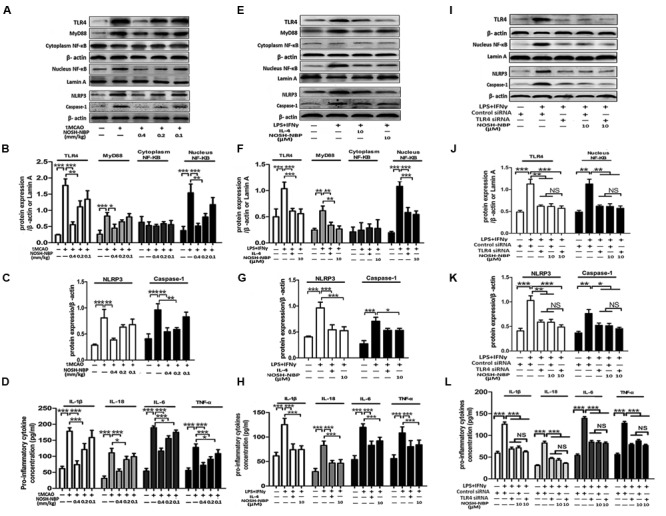
NOSH-NBP suppresses the relative expression of M1-markers through the TLR4/MyD88/NF-κB pathway and NLRP3 inflammasome in vivo and in vitro. In vivo, the model group and NOSH-NBP-treated group underwent tMCAO; the sham group underwent the same surgical procedure without the filament insertion. After MCAO being performed, mice in test compound groups were administrated with NOSH-NBP (0.4, 0.2, and 0.1 mm/kg) for 3 days. In vitro, BV2 microglia were treated with LPS (100 ng/mL) + IFN-γ (20 ng/mL), IL-4 (20 ng/mL), control siRNA, TLR4 siRNA, NOSH-NBP (10 μM) or a combination of these treatments. (A) Representative Western blot membranes for TLR4, MyD88, cytoplasm NF-κB, nucleus NF-κB, NLRP3 and caspase-1. (B,C) Quantitative analysis of TLR4, MyD88, cytoplasm NF-κB, nucleus NF-κB, NLRP3 and caspase-1 proteins expression levels (n = 3). (D) Quantitative analysis of pro-inflammatorty cytokines (IL-1β, IL-18, IL-6, and TNF-α) concentration (n = 5). (E) Representative Western blot membranes for TLR4, MyD88, cytoplasm NF-κB, nucleus NF-κB, NLRP3, and caspase-1. (F,G) Quantitative analysis of TLR4, MyD88, cytoplasm NF-κB, nucleus NF-κB, NLRP3, and caspase-1 protein expression levels (n = 3). (H) Quantitative analysis of pro-inflammatorty cytokines (IL-1β, IL-18, IL-6, and TNF-α) concentration (n = 5). (I) Representative western blot membranes for TLR4, MyD88, cytoplasm NF-κB, nucleus NF-κB, NLRP3, and caspase-1. (J,K) Quantitative analysis of TLR4, MyD88, cytoplasm NF-κB, nucleus NF-κB, NLRP3, and caspase-1 protein expression levels (n = 3). (L) Quantitative analysis of pro-inflammatorty cytokines (IL-1β, IL-18, IL-6, and TNF-α) concentration (n = 5). Data are expressed as the mean ± SD and were analyzed by one-way ANOVA followed by post hoc Tukey test: ∗∗∗P < 0.001, ∗∗P < 0.01, ∗P < 0.05.