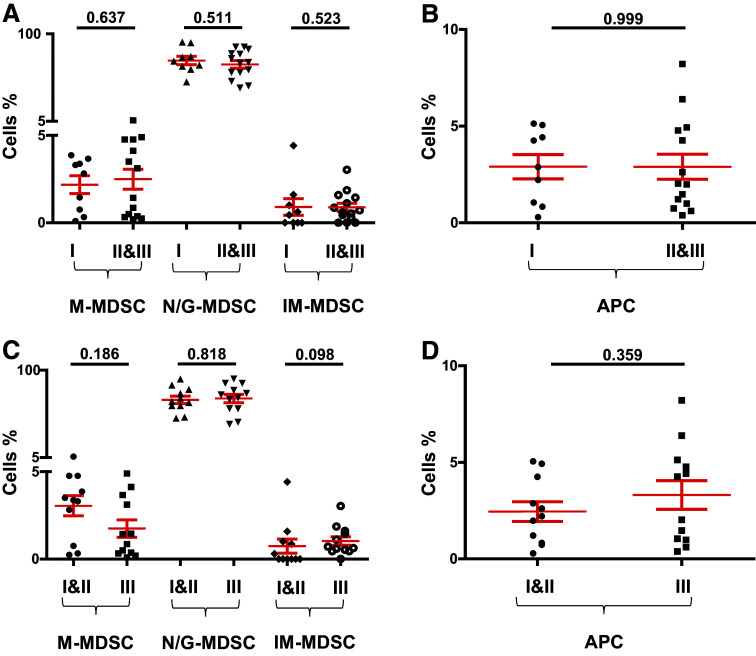
Fig. 3.
Comparisons of levels of different subsets of circulating myeloid cells between PBC patients with different tumor stages and histological grades. Scatter plots showing calculated percentages ± SEM of CD33+CD11b+HLA-DR−/lowCD14+ M-MDSC, CD33+CD11b+HLA-DR−/lowCD15+ N/G-MDSC and CD33+CD11b+HLA-DR−/lowCD14−CD15− IM-MDSC in patients with stage I (n = 9) compared to stage II and III patients (n = 14) (a) and calculated percentages ± SEM of CD33+CD11b+HLA-DR+ APC (b). Scatter plots showing calculated percentages ± SEM of M-MDSC, N/G-MDSC and IM-MDSC in patients with histological grade I and II (n = 11) compared to grade III patients (n = 12) (c) and calculated percentages ± SEM of APC (d)

