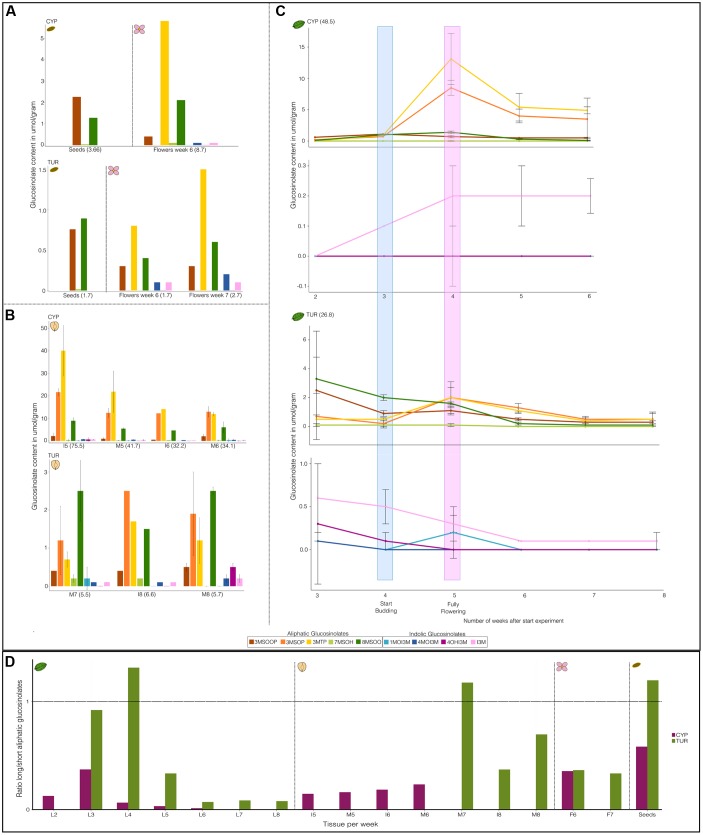
FIGURE 2.
Time course of glucosinolate (GS) composition of different tissues of Aethionema arabicum accessions CYP and TUR. Shown are the averages and standard deviations. Bars and points with standard deviations have a sample size of n = 3. Bars and points without standard deviations were from pooled tissue (hence n = 1). All y-axes have a different scale. Numbers in brackets are total GS content in umol/gram dry weight. (A) Seed and flower GS. (B) Fruit GS. I = immature fruit, M = Mature fruit. Numbers of the abbreviations along the x-axis are the weeks from the start of the experiment. (C) Leaf GS: for every line (CYP or TUR) the top graph are the aliphatic GS and the bottom the indolic GS. Highlighted are the number of weeks after which plants start budding (blue) or are in full bloom (pink). (D) Ratio of long versus short aliphatic glucosinolates (GS). The ratio is calculated as the sum of all C7 and C8 GS divided by all C3 GS. The x-axis shows the tissues (L = leaves, I = immature fruits, M = mature fruits, F = flower, Seeds = ripened seeds). Numbers following the abbreviations are the weeks after the start of the experiment. Vertical dotted lines divide the graph into the different tissues.

