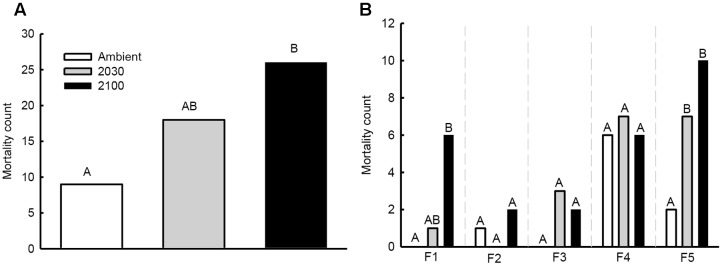
FIGURE 2.
Seedling mortality counts at the experiment conclusion: (A) all fungal strains combined, and (B) differences between fungal strain as identified in generalized linear models (strains F4 and F5) and chi-squared tests (strains F1, F2, and F3). Different letters above counts represent statistically significant (P < 0.05) differences among climate change scenarios.

