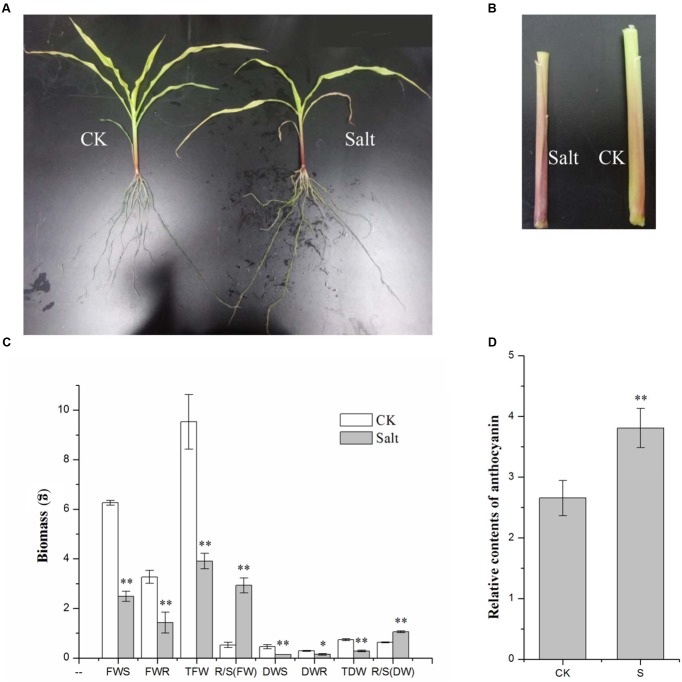
FIGURE 1.
Phenotypic changes of maize seedlings under salt stress. (A) Phenotypic changes. (B) Anthocyanin accumulated in the roots. (C) Changes of biomass (FWS, fresh weight of the shoot; FWR, fresh weight of the root; TFW, total fresh weight; DWS, dry weight of the shoot; DWR, dry weight of the root; TDW, total dry weight). (D) Relative contents of anthocyanin (CK, control; S, salt). (∗p ≤ 0.05, ∗∗p ≤ 0.01).

