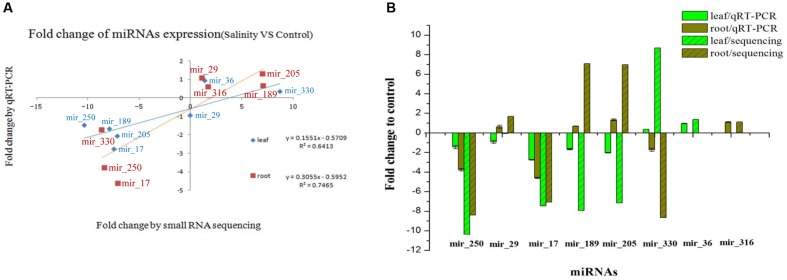
FIGURE 5.
Validation and comparison of the expression of eight novel miRNAs between qRT-PCR and sRNA sequencing. (A) The miRNA expression correlation between qRT-PCR and sRNA sequencing (salinity vs. control). (B) The fold change of miRNA expression relative to the control sample. The bar represents the standard deviation.

