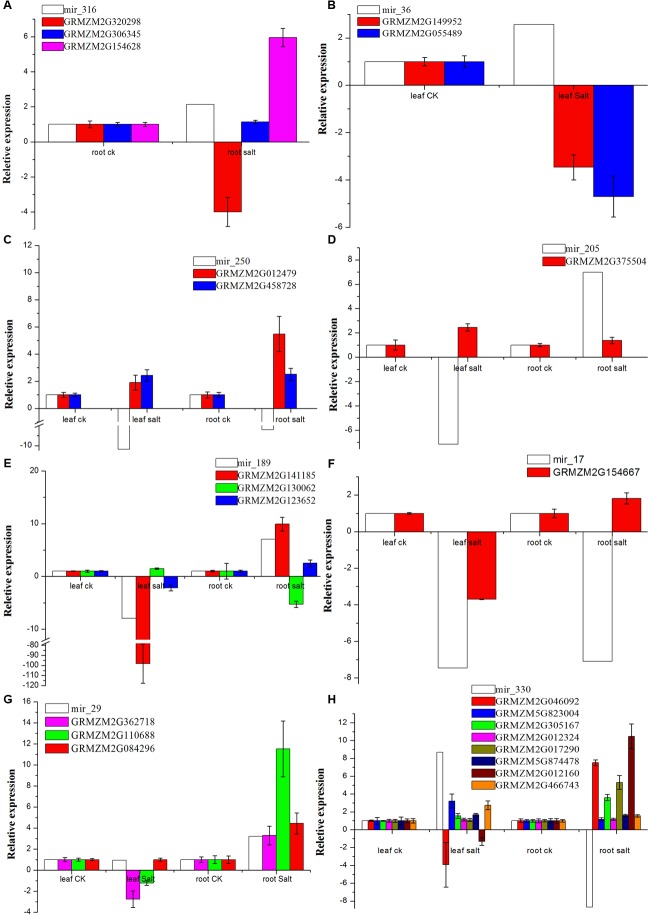
FIGURE 6.
Expression of targets vs. eight novel miRNAs by qRT-PCR. (A–H) Indicates the expression of targets for mir_316, mir_36, mir_250, mir_205, mir_189, mir_17, mir_29 and mir_330, respectively. The relative expression levels for the target genes are the means of the fold changes and the standard deviation from three biological replicates.

