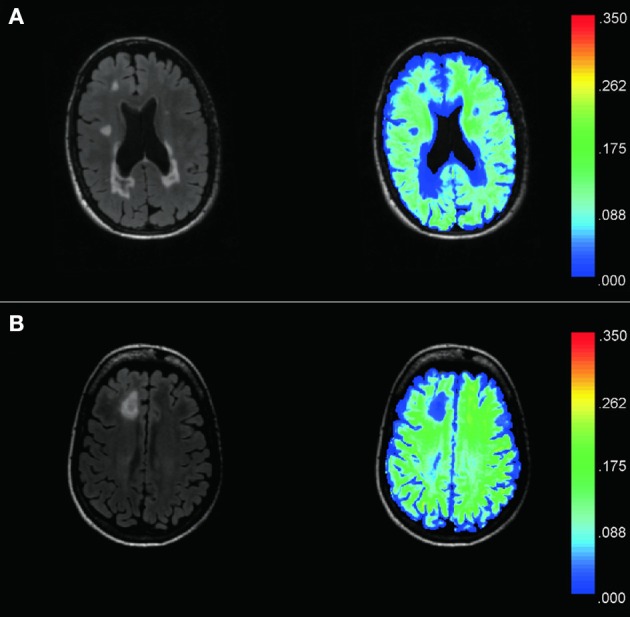
Figure 1.

Examples of T2 FLAIR images (left) from two MS patients (A,B) and corresponding MWF maps (right) demonstrate good spatial resolution and sensitivity to visually T2 hyperintense lesions. The color bar represents the range of MWF values. Hyperintense lesions on T2 Flair images are found to have low MWF values as compared to the surrounding NAWM. MWF also appears sensitive to dirty WM, as shown by the low MWF displayed in dark/light blue within the central white matter of (B).
