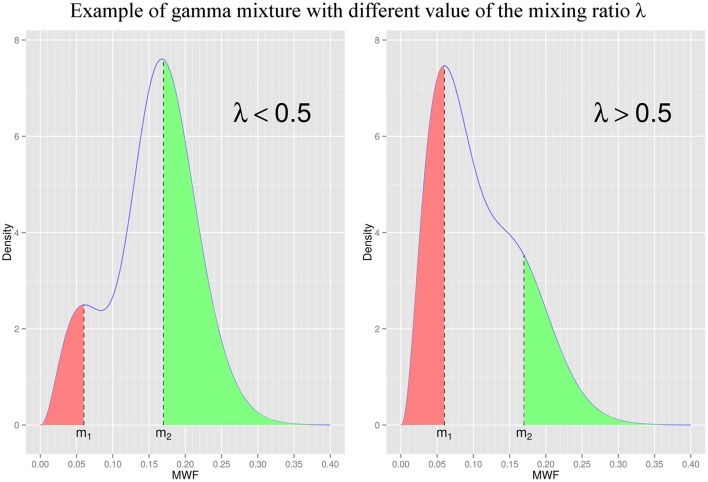
Figure 2.
Illustration of the same gamma mixture distribution with two different values of λ. m1 and m2 are the modes (most frequent values) of the low and high MWF components of the gamma mixture, respectively. λ is the gamma mixture mixing ratio and represents the proportion of low MWF to high MWF (when λ is equal to 0.5, the two components have the same contribution in the gamma mixture). To compare the relationship between lesion/NAWM masks and each gamma mixture component we defined ROI[m1] and ROI[m2] as all voxels with MWF value less than m1 (in red) and greater than m2 (in green), respectively. We assumed the lesion mask had more overlap with ROI[m1] than ROI[m2], and the NAWM mask more overlap with ROI[m2] than ROI[m1]. (Left) Distribution with a λ value less than 0.5 (exact parameters: m1 = 0.06, m2 = 0.17, λ = 0.25). (Right) Distribution with a λ value greater than 0.5 (exact parameters: m1 = 0.06, m2 = 0.17, λ = 0.75).

