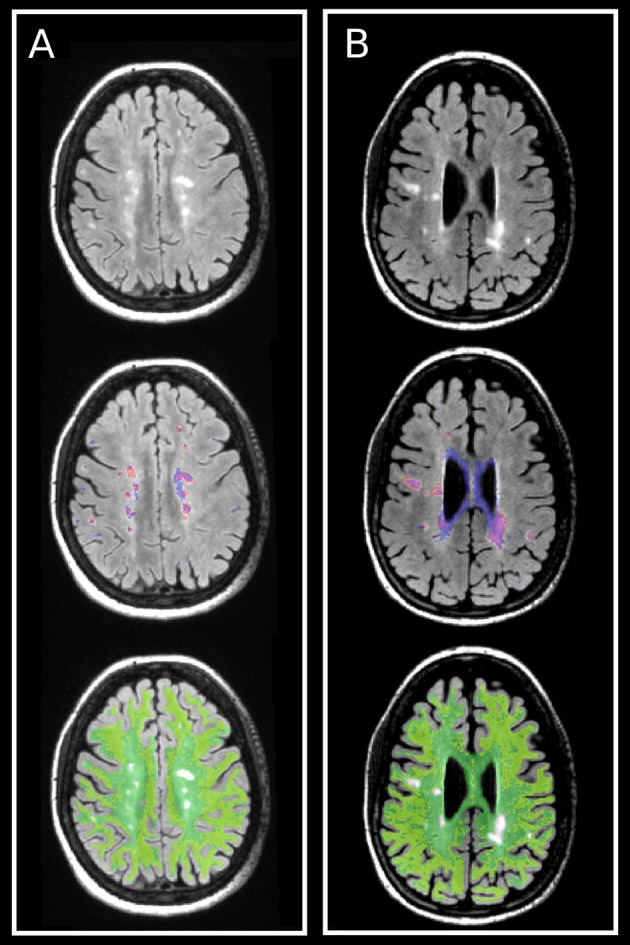
Figure 5.

Illustration of lesion and NAWM masks, and their relationships with the ROIs defined from the gamma mixture, ROI[m1] and ROI[m2], in one (A) RRMS and one (B) SPMS patients. (Top) FLAIR images with hyperintensities corresponding to lesions. (Middle) Lesion mask (red) and ROI[m1] (blue). (Bottom) NAWM mask (green) and ROI[m2] (yellow). ROI[m1] and ROI[m2] have been created from the gamma mixture so that not to overlap one with the other (cf. Figure 2), and as a result they only represent part (approximately half) of each gamma component. Despite this limitation, it can be clearly seen that the lesion mask is more similar to ROI[m1] than to ROI[m2], and that the NAWM mask is more similar to ROI[m2] than to ROI[m1], as corroborated by the DICE coefficient calculations shown in Figure 4.
