
Fig. 3.
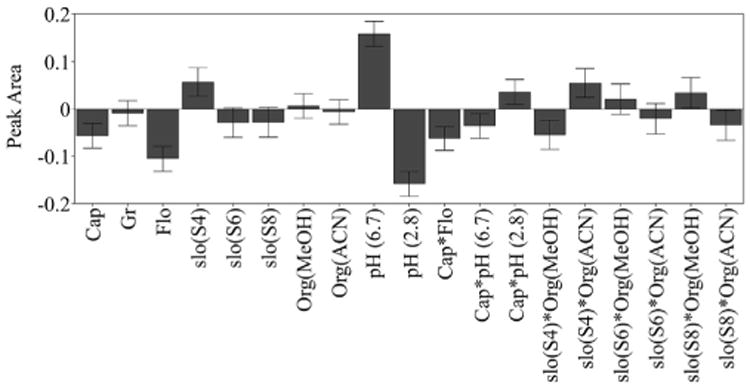
Regression coefficients plot scaled and centered for the peak area of 2,8-dihydroxyadenine. X-axis displays experimental factors and factor interactions that have significant effect on the peak area of 2,8-dihydroxyadenine and y-axis peak area. Error bars represent the 95% confidence interval. Cap, capillary voltage (kV); Gr, gradient steepness (min); Flo, flow rate (ml/min); Slo, slope; Org, organic mobile phase; MeOH, methanol; ACN, acetonitrile.