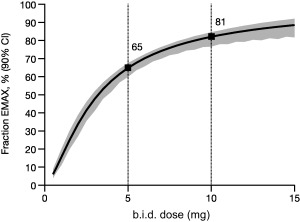
Figure 1.

Fraction of EMAX based on PASI75. Model‐predicted relationship vs. dose at Week 16 for a reference subject (median or typical covariate values) based on the pivotal studies. Solid line is the mean prediction and shading represents 90% CI bounds. b.i.d., twice daily; CI, confidence interval; EMAX, maximum drug effect; PASI75, 75% improvement from baseline in Psoriasis Area and Severity Index.
