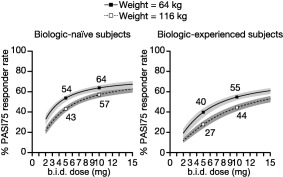
Figure 3.

PASI75 responder rate vs. dose in heavy vs. light weight subjects by prior biologic usage. The lines represent population mean PASI75 responder rate predictions, while the shaded regions represent 90% confidence intervals. The predictions are for baseline PASI of 20, males, with groups defined by covariates as shown in the legend and title. Predictions are based on OPT Pivotal 1 and 2. b.i.d., twice daily; PASI75, 75% improvement from baseline in Psoriasis Area and Severity Index score.
