Figure 4.

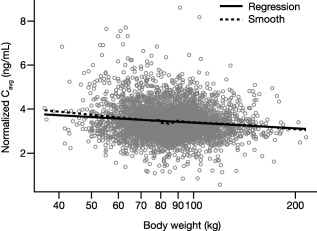
The relationship between dose‐normalized Cavg vs. body weight. Gray open circles are individual predictions from the PK model. Cavg, average plasma concentration; PK, pharmacokinetics.

The relationship between dose‐normalized Cavg vs. body weight. Gray open circles are individual predictions from the PK model. Cavg, average plasma concentration; PK, pharmacokinetics.