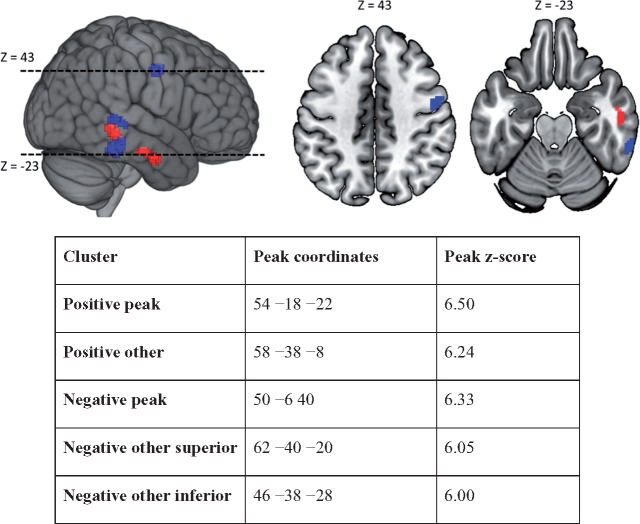
Figure 2.
VBM results. Five clusters of voxels survive a whole brain correction for multiple comparisons: two positive clusters (in red, associating increased grey matter with increased task score) on the right middle temporal gyrus, with the more posterior of the two bracketed by two negative clusters (in blue associating decreased grey matter with increased task score), and a further negative cluster on the right precentral gyrus (premotor area 6). Peak positive and negative clusters are displayed in axial slices (peak negative at Z = 43 mm and peak positive at Z = −23 mm). The table displays peak coordinates for all five clusters, together with the Z-score at that peak.

