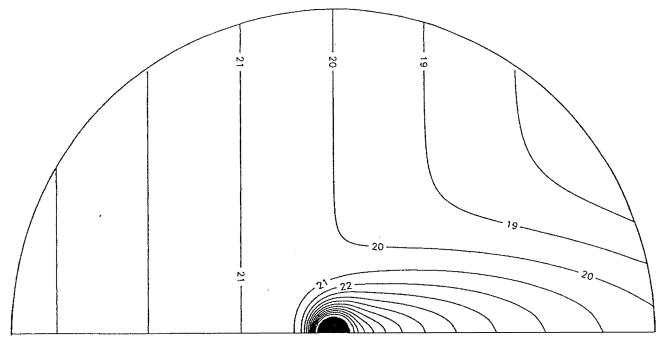
FIGURE 20.
Contour plot showing variation of PO2 around an arteriole. On the blood-wall interface P = PIumen = 31.6 torr. The arteriolar lumen is shown in black. The avascular wall is not shown for the sake of clarity. Capillary flow is from left to right. A “wake” of elevated PO2 is formed behind the arteriole as a result of diffusive exchange between arteriole and the surrounding tissue. (From Weerappuli, D. P.V. and Popel, A. S., J. Biomech. Eng., 111, 24, 1989. With permission.)

