
FIGURE 7.
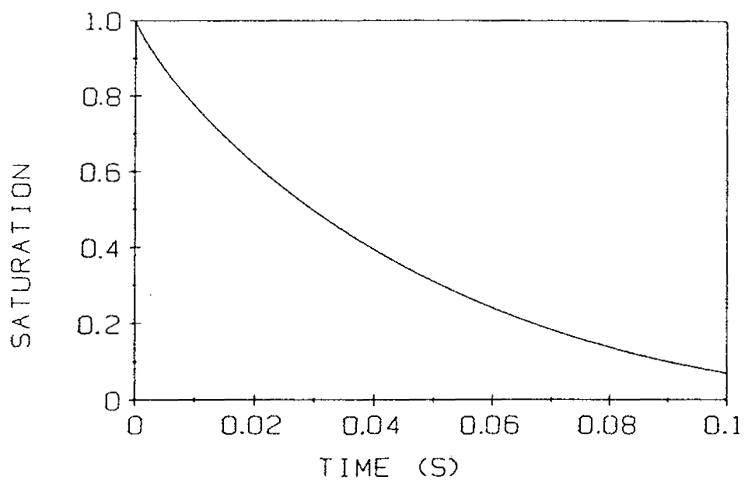
Mean red-cell hemoglobin saturation fraction as a function of dimensional time, according to Equation 47, for a red cell exposed to a zero oxygen tension at the cell boundary. The time required to go from an initial saturation SA to a saturation of SB is tB – tA, where tA and tB are the time coordinates corresponding to SA and SB on the graph. The slope of the curve decreases, hence unloading a given amount of O2 takes longer at lower saturation. (From Clark, A., Jr., Federspiel, W. J., Clark, P. A. A., and Cokelet, G. R., Biophys. J., 47, 171, 1985. With permission.)