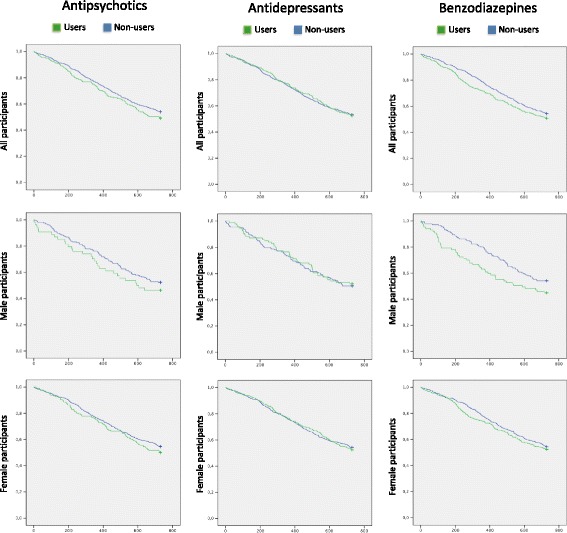
Fig. 2.

Unadjusted Kaplan–Meier survival curves. Notes: Green lines signify people with ongoing drug treatment at baseline, whereas blue lines signify non-users at baseline. Time, in days, is placed on the x-axis and cumulative survival on the y-axis. The analyses of antipsychotics and benzodiazepines include related drugs, as described in methods
