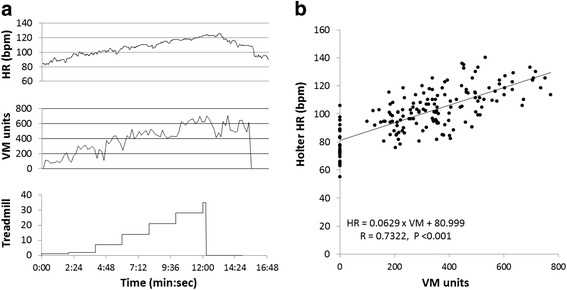
Fig. 1.

Heart rate and Actigraph VM recording during treadmill exercise testing. a Holter heart rate (top) and Actigraph activity in VM (middle) recording during 7 levels of treadmill exercise testing (bottom) in one patient. b the correlation between Holter heart rate and levels of VM during treadmill exercise testing in all 26 patients. Each dot represents the measurement of a maximal VM value in one of 7 levels of treadmill exercise testing
