Fig. 3.

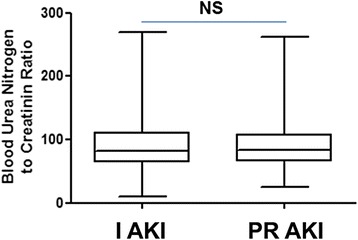
Distribution of blood urea nitrogen to creatinine ratio (BCR) according to AKI groups. The line in the middle of the box is plotted at the median and whiskers delimit min to max values

Distribution of blood urea nitrogen to creatinine ratio (BCR) according to AKI groups. The line in the middle of the box is plotted at the median and whiskers delimit min to max values