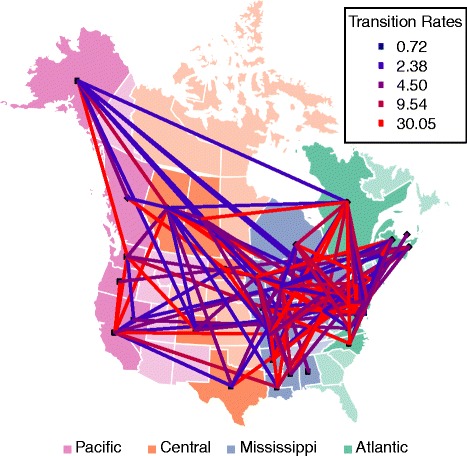
Fig. 1.

Viral migration and migratory flyways in North America. Viral migration rates were inferred from the PB2 gene segment (an exemplar of the AIV data set as a whole). US states and Canadian provinces (locations) are color-coded according to their flyway assignment. No viruses were analyed from locations that have a light color. The color of each line connecting two locations corresponds to the inferred rate. The absence of a line connecting two locations suggests that the migration rate was 0
