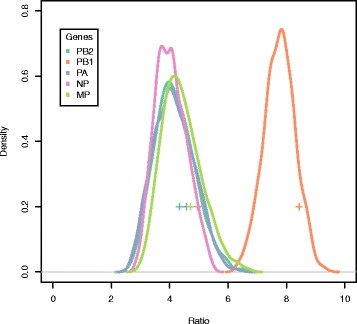
Fig. 5.

Uncertainty analysis of flyway assignment across localities. Plots showing the distribution of the mean within-to-between ratios with alternative location to flyway assignments for each gene. For each gene, the curve represents the normalized probability function estimated from different flyway assignments. Each cross shape represents the mean within-to-between ratio estimated from the standard flyway assignment used in the other figures and desribed in the results
