Fig. 7.

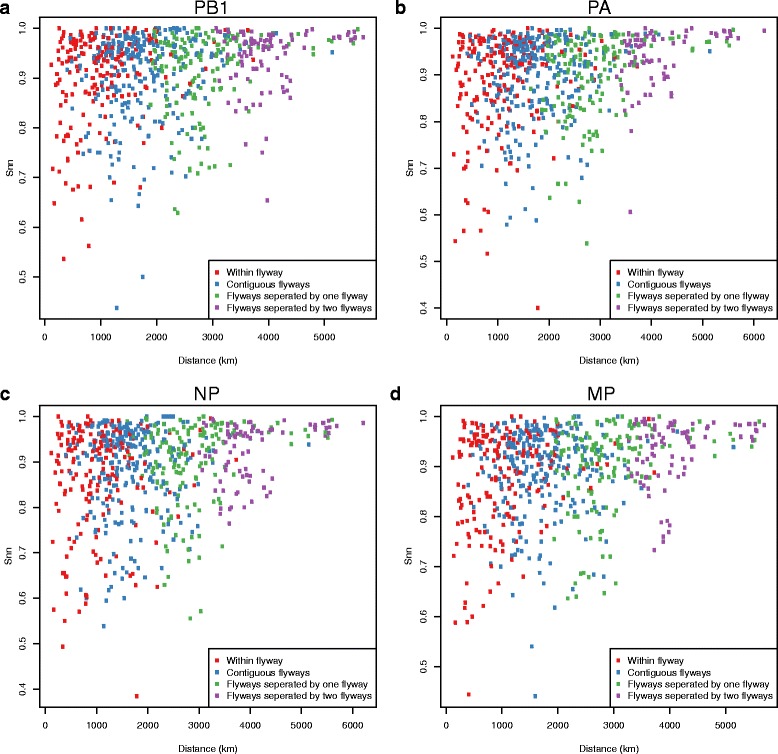
Gene flow between pairs of localities plotted against their geographic distance. Plots of the nearest neighbour statistic (Snn) against spatial distance for each pair of localities for the PB1, PA, NP, and MP gene segments

Gene flow between pairs of localities plotted against their geographic distance. Plots of the nearest neighbour statistic (Snn) against spatial distance for each pair of localities for the PB1, PA, NP, and MP gene segments