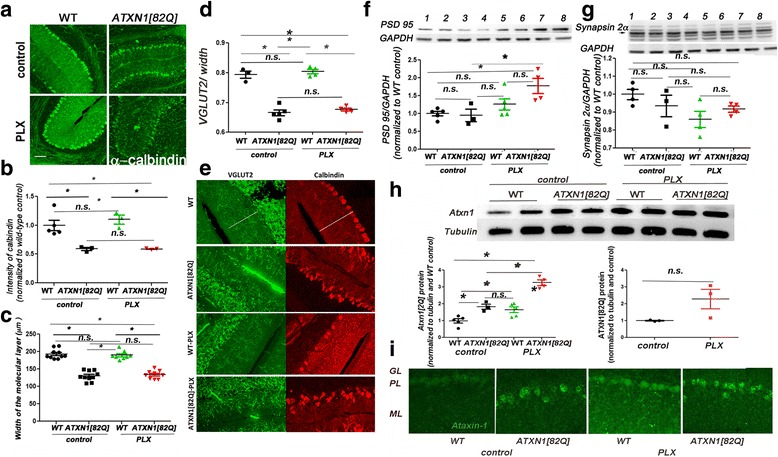
Fig. 5.

PLX does not improve pathological changes in Purkinje neurons. a Representative confocal images of 3-month-old WT and ATXN1[82Q] mice fed regular (control) or PLX chow (PLX). Cerebellar slices were stained with a Purkinje neuron specific anti-calbindin antibody. Scale bar, 100 μm. b Quantification of Calbindin intensity. c Width of the molecular layer. d, e To investigate synaptic loss, cerebellar slices were co-stained with VGLUT-2 and calbindin. Quantification of the extension of VGLUT2 positive synaptic puncta over the width of molecular layer (d). Note that in these images, decrease in calbindin is not detectable (e). The reason for this is that for imaging calbindin in this experiment, we have used different exposures to obtain similar calbindin intensity over samples to increase accuracy of quantifying the length of VGLUT2 staining over calbindin. f, g WB was used to quantify protein expression of pre-synaptic marker synapsin 2a (g, indicated by arrow) and post-synaptic marker PSD95 (f) N ≥ 3 . In representative WB image, samples are wild-type controls (lanes 1 and 2), ATXN1[82Q] controls (lanes 3 and 4), wild-type PLX-treated mice (5 and 6), and ATXN1[82Q] PLX-treated mice (7 and 8). h, i. Ataxin-1 protein levels were examined using Western blotting of cerebellar lysates from 3-month-old PLX and control-treated SCA1 and wild-type mice (h) and immunofluorescence of cerebellar slices (i). N ≥ 3. Each dot represents one mouse, and values indicate mean ± SEM. Asterisk indicates p < 0.05 by one-way ANOVA followed by Bonferroni post hoc test or Student’s t test, presence of n.s. indicates that p > 0.05 and that data was not significantly different
