
Fig. 9.
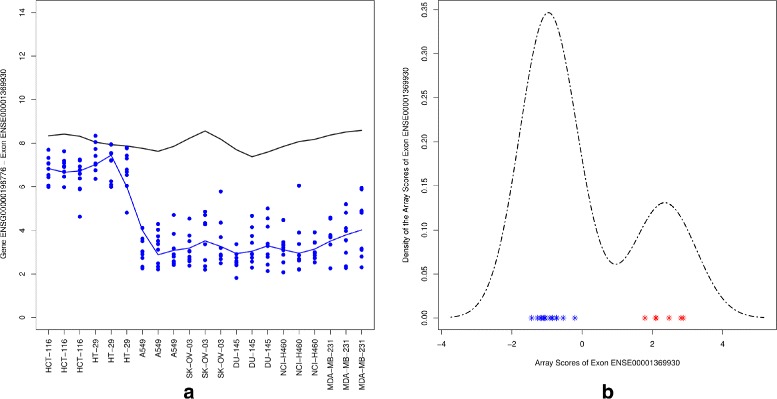
Probe set ENSE00001369930. Left panel: gene level and exon level data. The black and blue lines indicate the mean profiles of the gene and exon level data respectively. The blue dots show the probe level data. Right panel: a density plot for array scores showing the values of group 1 (red) and group 2 (blue)