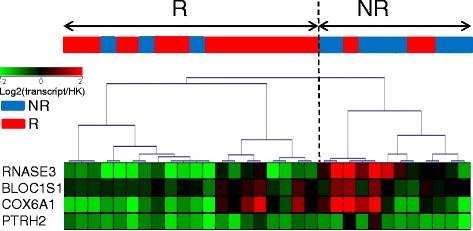
Fig. 4.

Validation of a small transcript combination associated with response to abatacept/methotrexate (ABA/MTX) in subset 2. A minimal combination of four transcripts (RNASE3, BLOC1S1, COX6A1, PTRH2) was identified by logistic regression from the 87 transcripts previously identified with subset 1. Next, the ability of these four transcripts to predict ABA/MTX response was evaluated by quantitative reverse-transcription (qRT)-PCR with subset-2 samples. Hierarchical clustering based on normalized qRT-PCR values was built with the Pearson coefficient metric and complete linkage. These data allowed good categorization of 16 out of 19 responders (R) and 10 out of 13 non-responders (NR), for a total of 26 among the 32 patients with RA overall in subset 2. Intensity values were expressed as an expression ratio (transcript/housekeeping (HK) gene)
