Fig. 4.

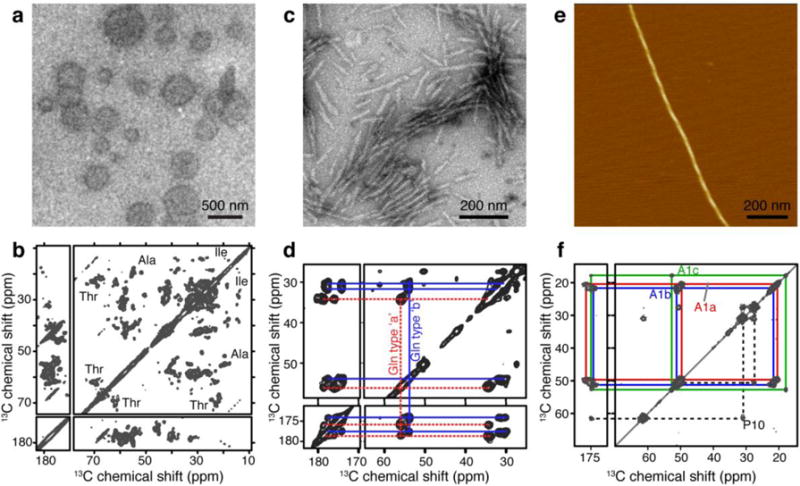
Examples of samples packed with ultracentrifugal devices. (a) TEM of TOCL/DOPC/cholesterol (0.15:0.75:0.10 molar ratio) vesicles with bound cytochrome c. (b) 13C-13C CP DARR spectrum of 1.7 mg of U-13C,15N cytochrome c bound to TOCL/DOPC (1:4 molar ratio) vesicles measured at a sample temperature of 233 K. (Adapted from (Mandal et al. 2015), Copyright 2015, with permission from Elsevier.) (c) TEM on [U-13C-15N]-labeled huntingtin exon 1 fibrils prepared for ssNMR. (d) 13C-13C CP DARR spectrum of 4.4 mg of htt exon1 fibrils measured at 275 K and 13 kHz MAS. Panels (c–d) are adapted from (Hoop et al. 2016). (e) AFM on C18-(PEPAuM-ox)2 fibers. (f) 13C-13C CP DARR spectrum of 1.9 mg of C18 -(PEPAuM-ox)2 peptide nanofibrils measured at 277 K. Panels (e–f) are adapted with permission from (Merg et al. 2016). Copyright 2016 American Chemical Society. The NMR measurements were performed on a 600 and 800 MHz (1H) spectrometer using 3.2 mm MAS rotors.
