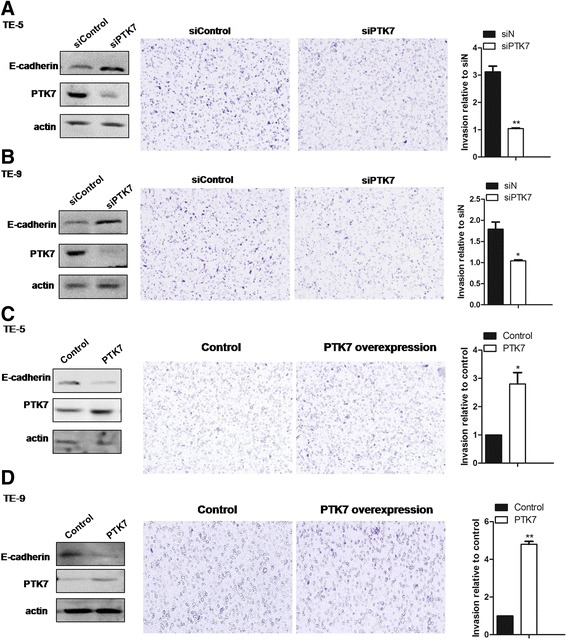
Fig. 4.

PTK7 positively cell invasion in esophageal squamous tumor cells. a and b western blots of PTK7 and E-cadherin were performed for the siPTK7 and control cells in TE-5 (a, left panel) and TE-9 (b, left panel). Transwell assays were performed in TE-5 and TE-9 (a and b, middle panels). Quantification of the results shown in (a and b, right panels). c and d PTK7 was overexpressed in TE-5 and TE-9 cells. Western blots of PTK7 and E-cadherin (left panels), Transwell migration assays (middle panels), and the quantification of cell migration (right panels) of the PTK7-overexpressing and control cells are presented. (mean ± S.D., n = 3, *p < 0.05, **p < 0.01, Student’s t test)
