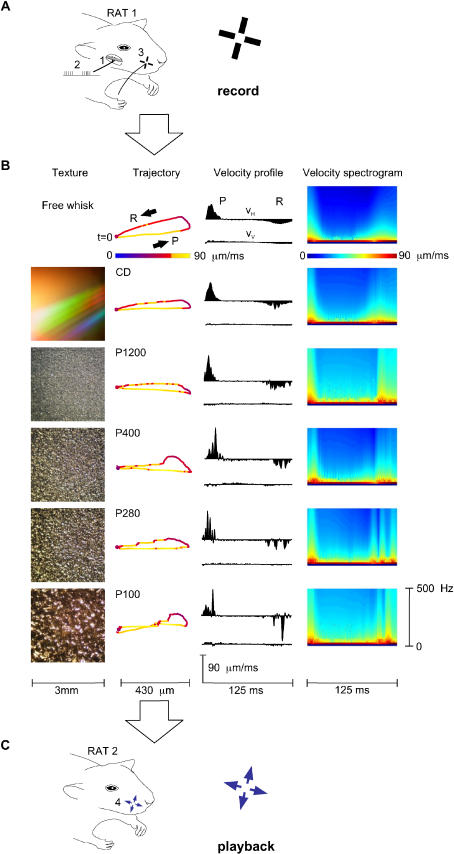
Figure 1. Collection and Playback of Texture Library.
(A) Whisker vibration data were collected during “electrical whisking,” induced by stimulation of the facial nerve (1) with pulse trains (2) in rat EW3. An optical sensor, shown schematically by two orthogonal light paths (3), monitored vertical and horizontal whisker motion of whisker C3.
(B) “Texture” column: Photographs of the 5 surfaces used. “Trajectory” column: Sample whisker trajectories (first whisk of trial 50) associated with free whisking and the five surfaces. Each point, separated by 1 ms, gives the horizontal and vertical position; the trajectory begins with protraction (P) at t = 0 and terminates 125 ms later at the end of retraction (R). Speed is given by the color of each point. Note the irregularities—jumps, stops, and starts—induced by whisking on sandpaper. “Velocity profile” column: Whisker trajectories displayed according to the horizontal and vertical velocities (VH and VV, respectively). P refers to protraction phase (positive VH), and R to retraction phase (negative VH). In this and all figures, VH and VV were calculated 7,634 times per second. “Velocity spectrogram” column: Velocity spectrograms for each texture (see Materials and Methods).
(C) Playback of the whisker trajectories to a second group of rats through a piezoelectric motor (4), shown schematically by the horizontal and vertical arrows at the base of the whisker.

