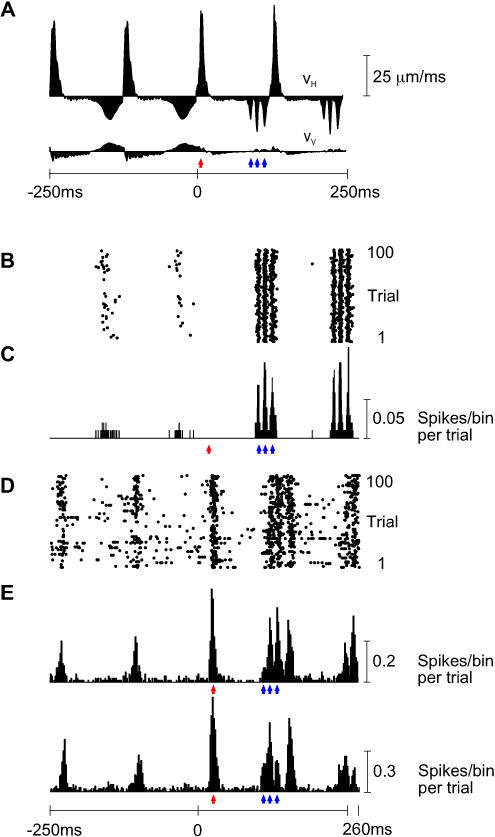
Figure 2. Sensory Receptor and Cortical Coding Properties.
(A) VH and VV for two free whisks followed by two P280 whisks. The labeling conventions are as in Figure 1B. Each presented trial was unique due to small variations in whisker trajectory even on the same surface (Figure 7); the illustrated velocity profiles are the averages of 100 trials. The red arrowhead indicates the time of the first VH peak during whisker protraction on P280; blue arrowheads indicate the times of the three VH peaks during whisker retraction on P280.
(B) Raster plot of first-order neuron aligned with the whisker trajectories, in response to 100 unique trials. Stimuli were applied to whisker E4.
(C) PSTH of first-order neuron with 0.2-ms bins. Blue arrowheads indicate the times of maximum response to the three peaks in retraction velocity. The red arrowhead indicates the expected time of response to the peak in protraction velocity; however, the neuron did not respond to whisker protraction.
(D) Raster plot for the cortical neuron cluster recorded simultaneously with the first-order neuron.
(E) Two cortical PSTHs, both with 2-ms bins. The upper PSTH corresponds to the raster plot in (D); the lower PSTH is from a second cortical neuron cluster recorded simultaneously at a neighboring electrode (distance 560 μm). Blue and red arrowheads indicate the times of maximum response to the peaks in whisker protraction and retraction velocity, carried down from (A). The cortical neuron clusters responded to high velocities for both protraction and retraction. Because the first two peaks in retraction velocity were separated by just 7 ms, the resulting peaks in cortical response were fused. All PSTHs are extended to 260 ms to show responses to the final velocity feature.

