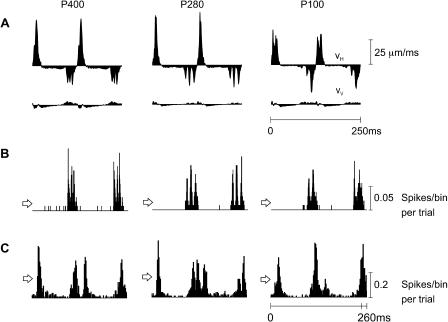
Figure 5. Texture Coding by Firing Patterns.
(A) VH and VV for two whisks on texture P400 (left), P280 (middle), and P100 (right). Each illustrated velocity profile is the average of 100 unique profiles.
(B) First-order neuron PSTHs (0.2-ms bins) aligned with the whisker trajectories.
(C) Cortical PSTHs (2-ms bins). PSTHs are extended to 260 ms. The arrowheads on the left side of PSTHs indicate mean firing rates.

