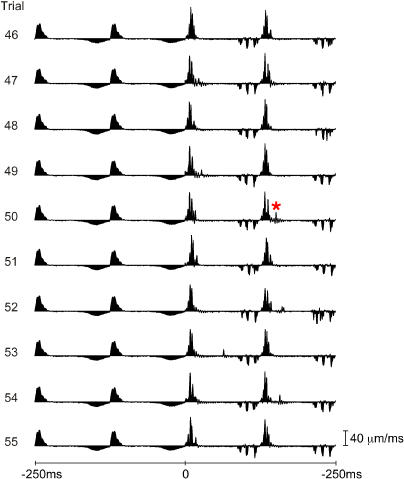
Figure 7. Velocity Profile Variability across Trials.
Ten successive trials are shown (numbers 46–55), each trial composed of the final two free-whisks (–250 to 0 ms) and the first two whisks on P280 (0 to 250 ms). Free whisk velocity profiles varied little across trials. When the whisker swept across P280 repeatedly, the fundamental kinetic signature was conserved (e.g., the three peaks in retraction velocity for P280) but minute details of the profile varied—note, for example, the velocity event (red asterisk) that occurred uniquely on trial 50.

