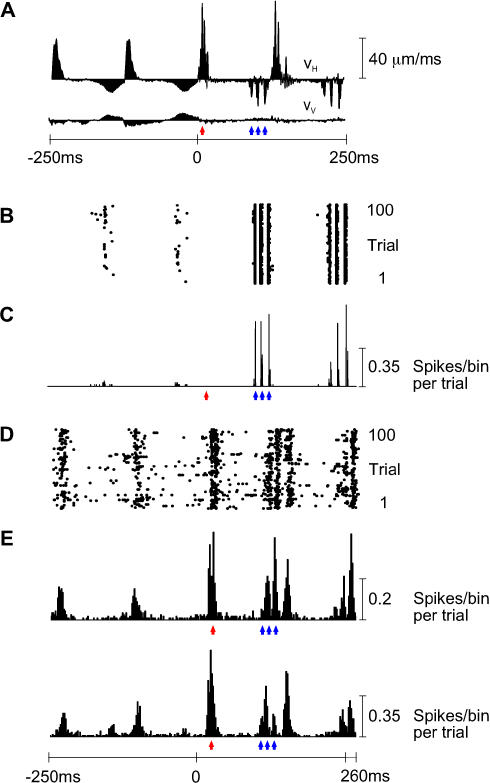
Figure 8. Sources of Neuronal Variability.
(A) VH and VV across the final two free whisks and the first two P280 whisks of trial number 50. Here, as in Figure 2, the red arrowhead indicates peak whisker velocity during protraction, and blue arrowheads indicate the peak whisker velocities during retraction.
(B and C) First-order neuron raster plot (B) and PSTH (C), aligned with the whisker trajectories, for 100 stimulus repetitions. Due to the temporal precision of neuronal responses, the vertical scale of the PSTH has been altered (compare to Figures 2 and 5) to reflect the large numbers of spikes within single bins.
(D) Cortical neuron cluster raster plot.
(E) Two cortical PSTHs from activity recorded simultaneously with the first-order neuron. The upper PSTH corresponds to the raster plot in (D); the lower PSTH is derived from a second cortical neuron cluster recorded simultaneously at a neighboring electrode (distance of 560 μm). PSTHs have 0.2-ms bins for the first-order neuron and 2-ms bins for the cortical neuron clusters. All PSTHs are extended to 260 ms to show responses to the final velocity feature. Response peaks are signaled by red and blue arrowheads according to the velocity events that evoked them.

