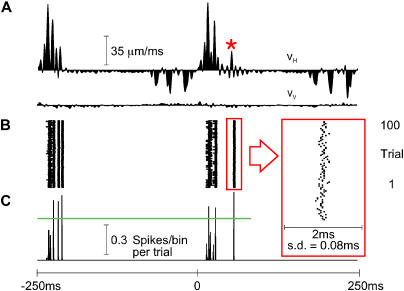
Figure 9. Precision of a First-Order Neuron.
(A) VH and VV across the first two P280 whisks of trial number 50 (see Figure 7).
(B and C) Raster plot (B) and PSTH (C) of the first-order neuron for 100 repetitions of the stimulus given in (A). Inset in red frame shows a magnified view of spikes emitted in response to a single velocity event (red asterisk in [A]) and their SD in time. The same measurement of jitter was carried out for each of the response peaks that surpassed the green horizontal line (see text).

