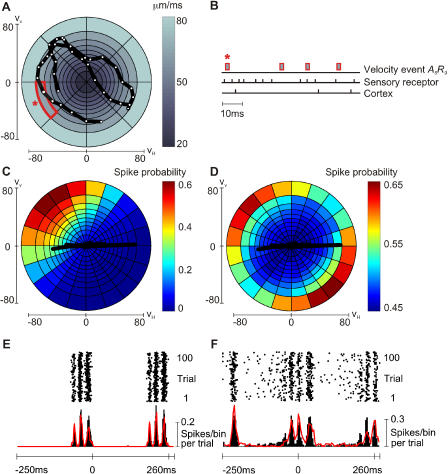
Figure 10. Velocity Tuning Curves and Simulated Texture Responses.
(A) A 5-ms trajectory of velocity white noise. Radial coordinates give VH, VV. Velocity space was subdivided such that each segment included the same number of events (3,435,300). One segment (red outline) is selected for further explanation (see text).
(B) 100-ms ganglion and cortical spike train aligned below occurrences of the velocity event of interest (red bar). After each such event, spike times were accumulated to build up a spike probability profile.
(C) First-order neuron spike probabilities, given by color scale, in relation to joint A,R events. To estimate the tuning curve in finer detail, the number of angles was increased to 20. Each segment now contains about 1,374,120 velocity events. One P280 whisk trajectory is superimposed.
(D) Spike probabilities for cortical neuron cluster, given by color scale, in relation to joint A,R events. One P280 whisk trajectory is superimposed.
(E) Simulated raster plot for first-order neuron and simulated (black) and real (red) PSTHs.
(F) Simulated raster plot for cortical neuron cluster and simulated (black) and real (red) PSTHs.

