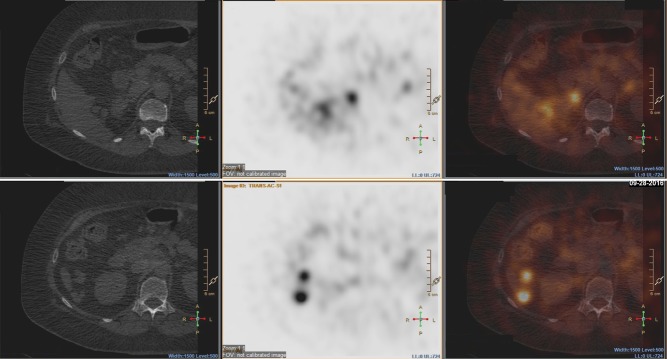
Figure 2.
Axial images of MIBG scan with single-photon emission computed tomography (SPECT). Upper panels, axial section corresponding to panel D in Figure 1. Lower panels, axial section corresponding to panel F in Fig. 1. Left, CT images; middle, MIBG scan with SPECT; and right, overlap of left and middle images. Note the masses are labeled with MIBG.

 This work is licensed under a