
Fig. 3.
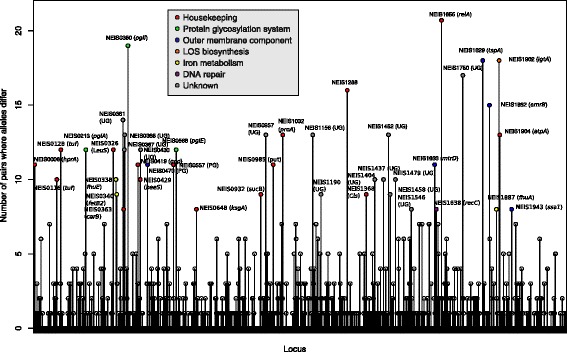
Frequency of changes in N. meningitidis core genome MLST genes between paired meningococcal carriage isolates. Vertical lines show frequency of pairs with allelic differences. Gene name and color coding according to functional group are added to the genes that most frequently differed (in ≥8 pairs). UD = undesignated gene, PG = putative gene function