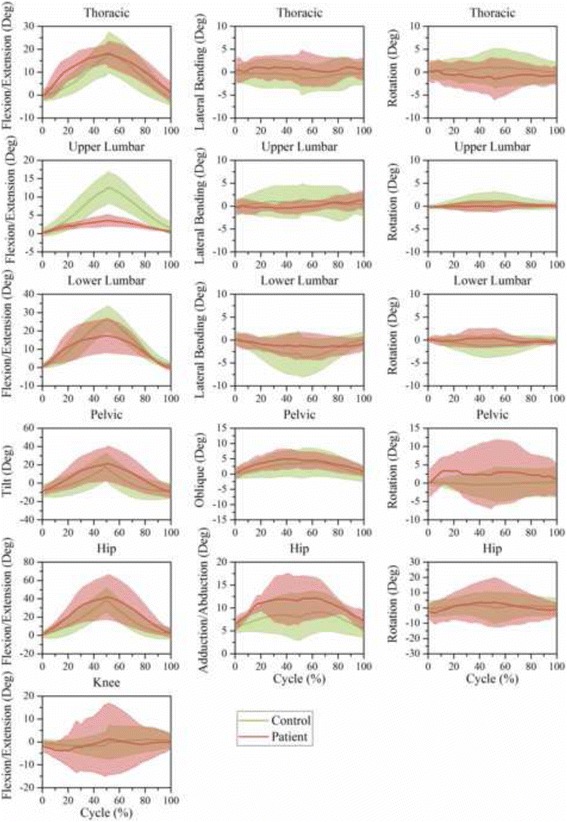
Fig. 8.

Time-series kinematic waveform data for the thorax, ULx, LLx, pelvis, hip and knee in the sagittal plane, frontal plane and transverse plane during trunk flexion. The green thick line and shaded regions are the means and one standard deviation bands for the control group. The pink thick line and shaded regions are the means and one standard deviation bands for the LDH group
