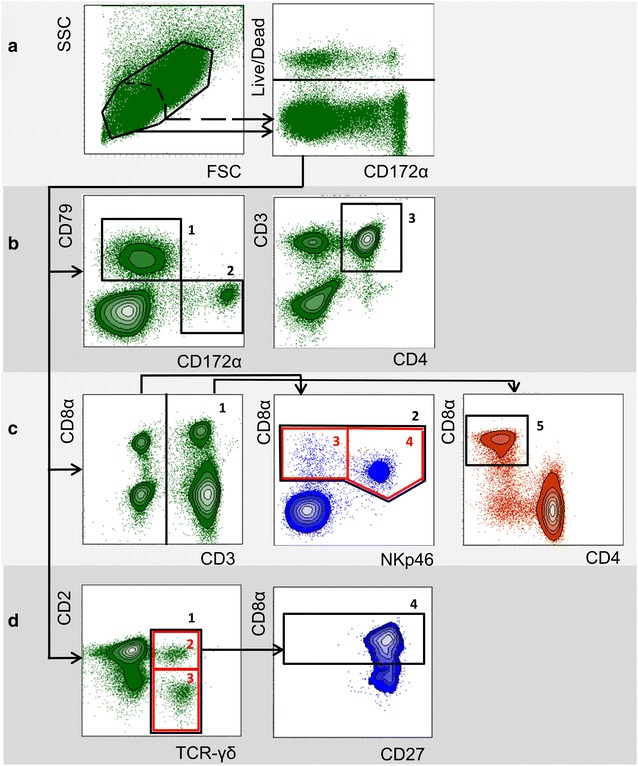
Fig. 1.

Gating strategy in flow cytometry for identification of myeloid cells and lymphocyte subpopulations. Representative data from one animal is shown. a Lymphocytes (scattered line) or lymphocytes and myeloid cells together (solid line) were gated according to forward scatter/side scatter properties (FSC/SSC). Dead cells were excluded in a consecutive gate. Live cells were further analysed by three different panels of antibodies (b–d, see also Table 2), used to identify various immune cell subpopulations. b Gate 1 CD79α+ cells (B cells); gate 2 CD172 α+ cells (myeloid cells); gate 3 CD3+CD4+ cells (CD4 T cells). c Gate 1 CD3+ cells (total T cells); gate 2 CD3−CD8α+ cells (total NK cells); gate 3 (red rectangle): CD3−CD8α+NKp46− cells (NK-cell subpopulation); gate 4 (red rectangle): CD3−CD8α+NKp46+ cells (NK-cell subpopulation); gate 5 CD3+CD4−CD8 α+ (cytolytic T cells). d Gate 1 TCR-γδ+ cells (total γδ T cells); gate 2 (red rectangle): CD2+TCR-γδ+ cells (γδ T-cell subpopulation); gate 3 (red rectangle): CD2−TCR-γδ+ cells (γδ T-cell subpopulation); gate 4 CD2+CD8α+CD27+/−TCR-γδ+ cells (γδ T-cell subpopulation)
