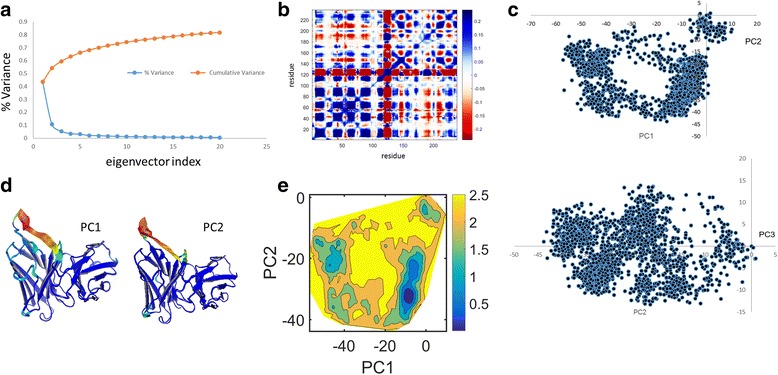
Fig. 3.

For the mutant protein the same type of cPCA results are shown as in Fig. 2. a) Thevariance and cumulative variance of the first twenty principal components. b) The reduced Q-matrix. c) Projections of the trajectory onto the planes formed by (PC1 and PC2) and (PC2 and PC3). d) The displacements along PC1 and PC2 are visualized and colored according to their RMSF for each residue using Pymol™. e) The free energy surface associated with the first two principal components
