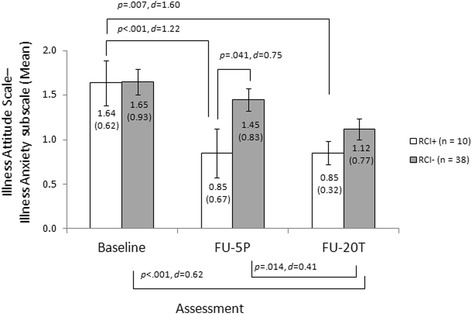
Fig. 3.

Mean values and standard deviations at pre-treatment, follow-up after 5 therapy-preparing sessions (FU-5P) and 20 therapy sessions (FU-20 T), between-group and inner-subject effect sizes and test statistics for the illness anxiety subscale of the Illness Attitude Scales (separately for patients who reached a clinically significant decline of illness anxiety symptoms after 5 therapy-preparing sessions [RCI+] versus patients who did not [RCI-])
