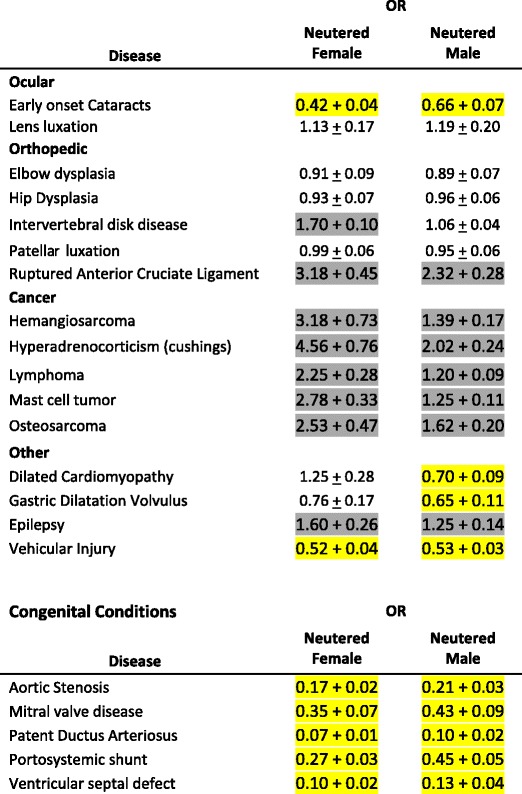
Table 2.
The odds ratio (OR) (± standard error) for the neutered dog relative to the intact dog for the conditions under study

Yellow shading indicates neutering was associated with reduced risk and dark gray shading indicates neutering was associated with an increased risk (p < 0.05). No shading indicates no difference in risk
