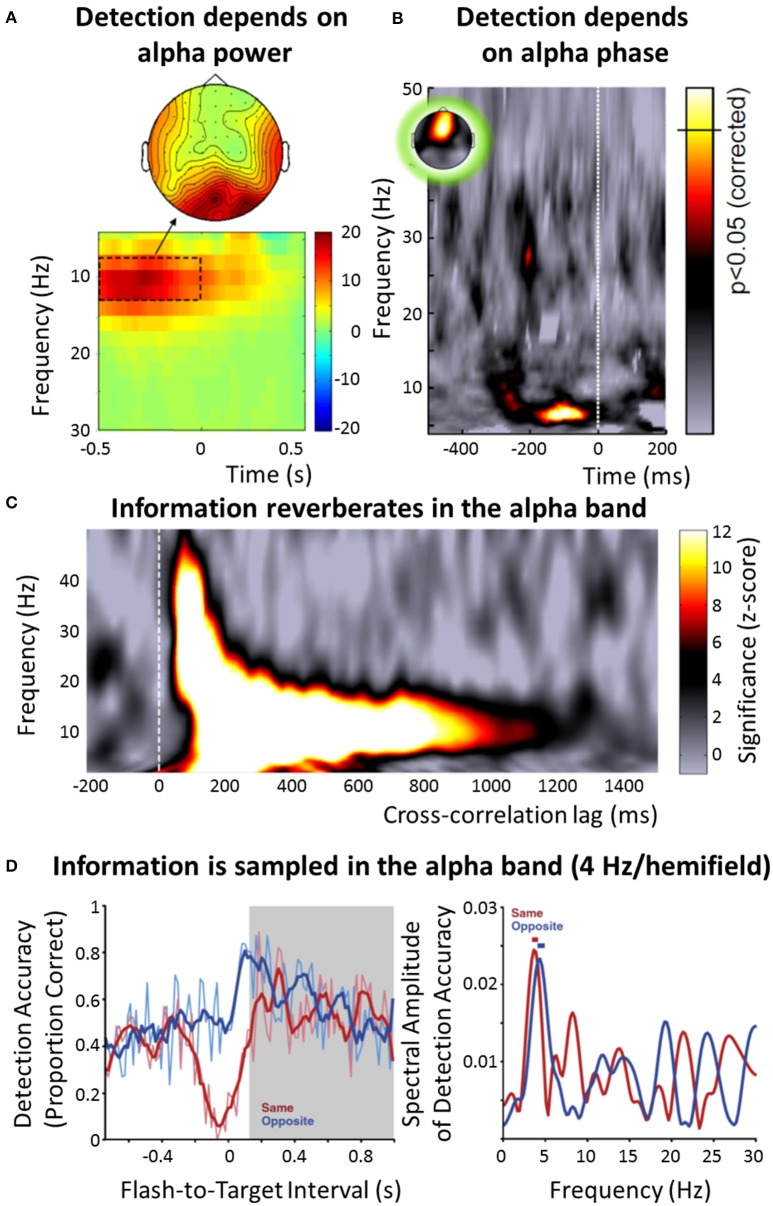
Figure 1.
Overview of the role of neural oscillations for stimulus selection and processing in vision. (A) Difference in EEG power (color-coded) around target onset between subjects that did not perceive near-threshold visual targets and those that did (reproduced with permission from Hanslmayr et al., 2007). Results indicate that visual detection depends on alpha power, with lower power leading to an improved detection. (B) Detection of a weak visual target also depends on the phase of the alpha band, as measured in the EEG (reproduced with permission from VanRullen et al., 2014, the original data is presented in Busch et al., 2009). The strength of modulation of target detection by the EEG phase in the respective frequency band is color-coded; the significance threshold is marked on the color bar. (C) When a random luminance sequence is presented to human subjects and their EEG is recorded in parallel, a reverberation (“perceptual echo”) of this visual information can be found in the electrophysiological signal for up to 1 s (using cross-correlation between luminance sequence and EEG), but only in the alpha band (reproduced with permission from VanRullen et al., 2014, the original data is presented in VanRullen and Macdonald, 2012). (D) After a visual stimulus cues attention to one visual hemifield, the probability of detecting a succeeding target fluctuates rhythmically, and in counterphase depending on whether the target occurred in the same or opposite hemifield (left; reproduced with permission from Landau and Fries, 2012). This “visual rhythm” fluctuates at 4 Hz per visual hemifield (right), indicating an overall sampling rhythm of 8 Hz, thus lying within the alpha band. Note that some effects (A,C) seem to have a somewhat higher frequency than others (B,D), leading to the distinction between an “occipital alpha” (~10 Hz) and a “frontal alpha” (~7-8 Hz) in this paper (following VanRullen, 2016).

