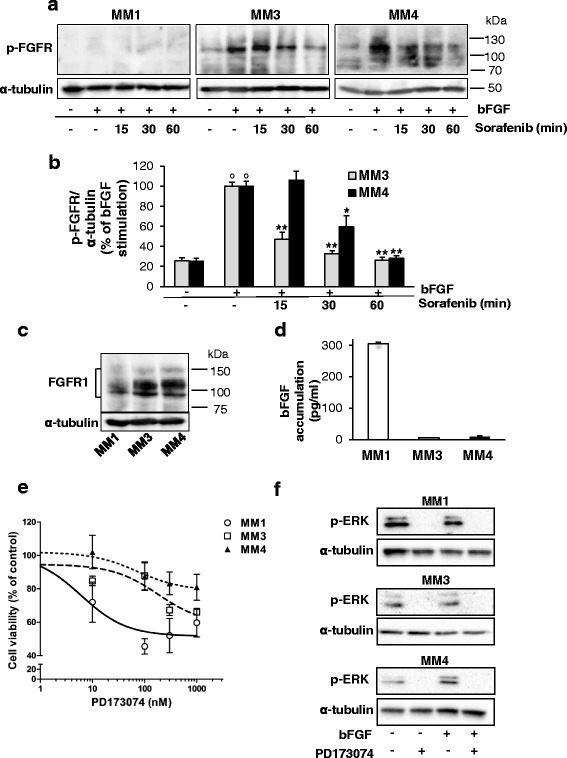
Fig. 7.

Sorafenib impairs FGFR1 activation in MPM TICs. a Western blot analysis using antibodies specific to phosphorylated FGFR in MM1, MM3, and MM4 cells stimulated with 20 ng/ml bFGF and treated with IC50 sorafenib for the indicated time points or vehicle-treated controls. Representative immunoblots are reported. b Data derived from densitometric analysis of at least three independent sets of experiments, expressed as mean ± SEM of the percentage values of the bFGF-induced FGFR phosphorylation (set as 100%). *p <0.05, **p <0.01 vs bFGF-stimulated cells; °p <0.05 vs vehicle-treated cells. c Western blot analysis using antibodies specific to total FGFR1 in MM1, MM3, and MM4 cells cultured in the absence of growth factors (EGF and bFGF). Blots were stripped and reprobed with anti-α-tubulin antibody to normalize for differences in protein loading. Representative immunoblots are reported (n = 3). d Quantitative evaluation of bFGF production in MPM cultures by ELISA. Data show the amount of bFGF released in 24 h by each TIC culture. e MPM TICs, serum-deprived for 24 h, were exposed to 0.001–1 μM PD173074 for a further 48 h and the effects analyzed by MTT assay. Values presented as percentage of the untreated control (100%) and represent mean ± SEM. f Western blot analysis of ERK1/2 phosphorylation in serum-starved conditions in the presence or absence of PD173074 (100 nM, 30 min) and/or bFGF (10 ng/ml, 10 min). Blots were reprobed for α-tubulin as protein loading control. bFGF basic fibroblast growth factor, FGFR FGF receptor
