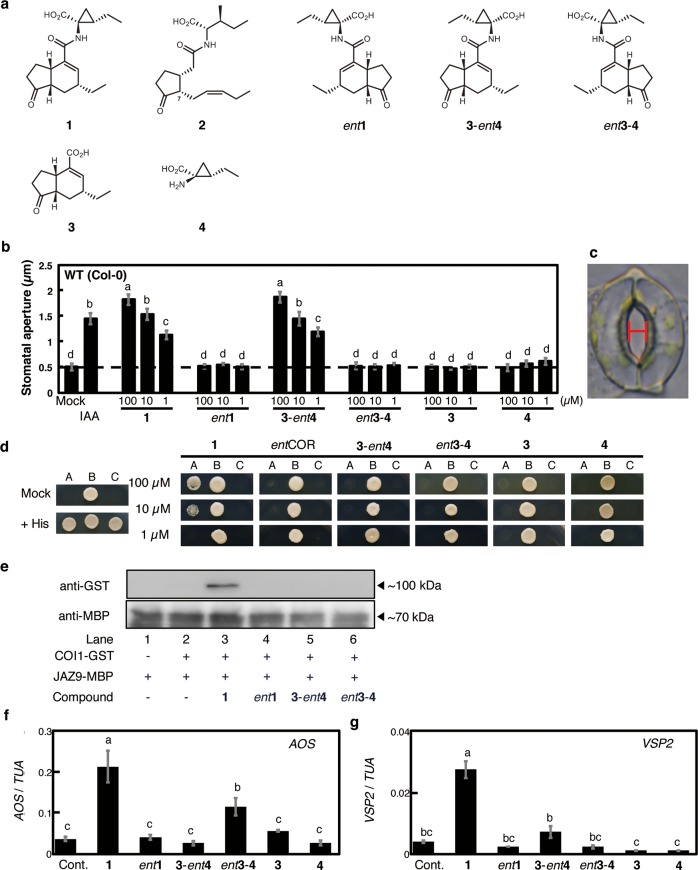
Figure 1.
Evaluation of the physiological action of coronatine relative and derivatives. (a) Structures of coronatine (1) relatives and derivatives: 7-epi-jasmonoyl-l-isoleucine (2), coronatine (1), and related compounds (ent1, 3-ent4, ent3-4, 3, and 4). (b) Effect of 1 derivatives on reopening (measured as size of aperture) of Arabidopsis thaliana (Col-0) abaxial stomata by abscisic acid (ABA). Indole-3-acetic acid (IAA), which induces stomatal reopening, was used as a positive control. Dashed line indicates the mean stomatal aperture taken from a control setting, in which Arabidopsis leaf peels with closed stomata were incubated in MES buffer (pH 6.2) containing 2% EtOH. Bars represent mean stomatal aperture and SE (n = 20 stomata). Letters a–d indicate significant differences between the means (ANOVA: P < 0.05). (c) A stoma in the epidermis of Arabidopsis thaliana. The width of the red bar was measured as the stomatal aperture. (d) Yeast two-hybrid (Y2H) assay of compound-induced COI1-JAZ9 coreceptor formation. Lane A: Yeast cells cotransformed with pDEST22-JAZ9 and pDEST32-COI1. Lane B: Yeast cells cotransformed with pDEST22-RalGDS-m1 and pDEST32-Krev1 as a positive control. Lane C: Yeast cells cotransformed with pDEST22-RalGDS-m2 and pDEST32-Krev1 as a negative control. (e) Pull-down assay of purified GST-COI1 (5 nM) with recombinant E. coli expressed MBP-JAZ9 (approximately 40 nM) in the presence of COR derivatives (100 nM). GST-COI1 bound to MBP-JAZ9 were pulled down with amylose resin, and analyzed by immunoblotting. HRP-conjugated anti-GST antibody was used for detection of GST-COI1. Anti-MBP antibody and HRP-conjugated rat IgG antibody was used for showing the amounts of MBP-JAZ9 as the input materials. (f, g) Relative transcript levels of AOS and VSP2 in A. thaliana treated with 1 derivatives. Each relative transcript level was assessed by quantitative RT-PCR. “Cont.” indicates the mean AOS or VSP2 transcript level in a buffer containing 2% EtOH only. Bars represent the mean AOS or VSP2 transcript levels of the test samples (100 μM). Bars represent mean and SE (n = 3). Letters a–c indicate significant differences between the means (ANOVA: P < 0.05).

