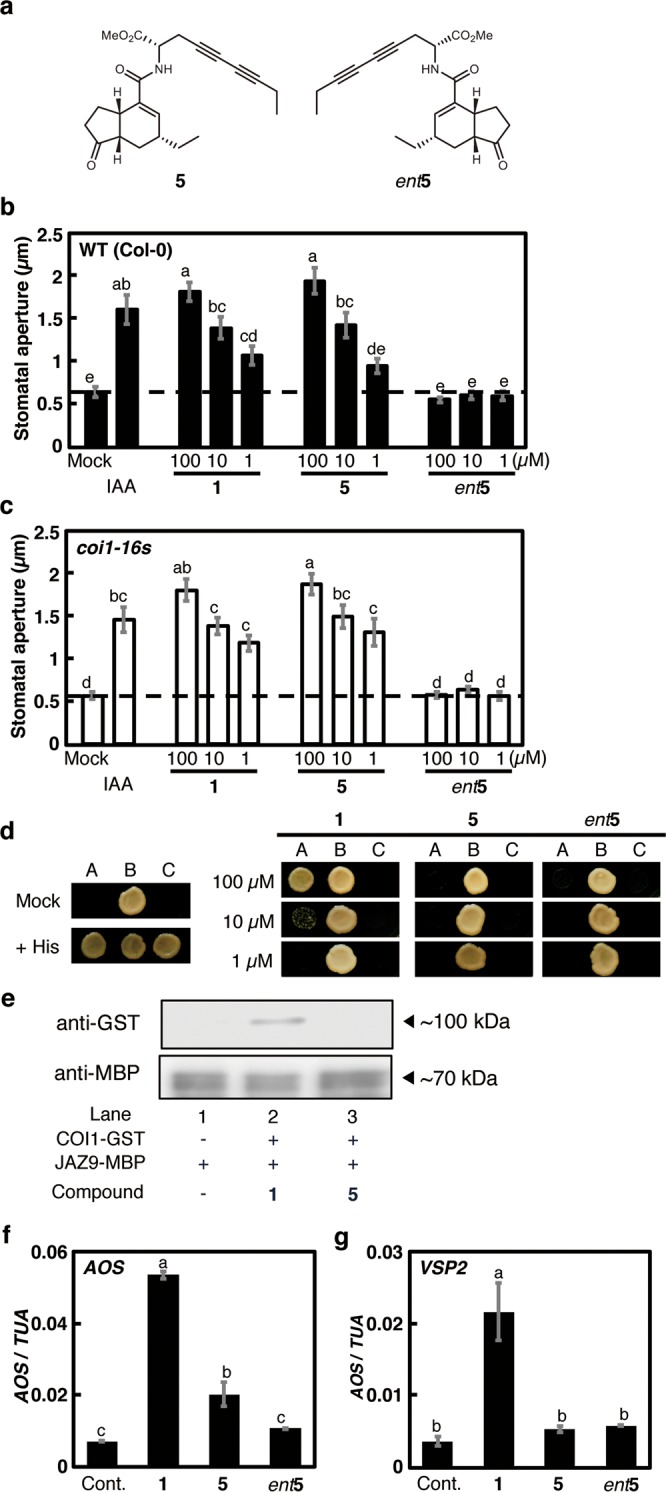
Figure 3.

Physiological evaluation of 5s. (a) Structure of 5 and ent5. (b, c) Effect of 1 and 5s on reopening of closed stomata in wild type Col-0 (b) and coi1-16s A. thaliana (c). IAA was used as a positive control. The dashed line indicates mean stomatal aperture of the control without 1 derivatives. Bars represent mean stomatal aperture and SE (n = 20 stomata). Letters a–e indicate significant differences between the means (ANOVA: P < 0.05). (d) Y2H assay of ligand-induced COI1-JAZ9 coreceptor formation. Lane A: Yeast cells cotransformed with pDEST22-JAZ9 and pDEST32-COI1. Lane B: Yeast cells cotransformed with pDEST22-RalGDS-m1 and pDEST32-Krev1 as a positive control. Lane C: Yeast cells cotransformed with pDEST22-RalGDS-m2 and pDEST32-Krev1 as a negative control. (e) Pull-down assay of purified GST-COI1 (5 nM) with recombinant E. coli expressed MBP-JAZ9 (approximately 40 nM) in the presence of diyne 5 (100 nM). All experiments were carried out according to the same procedure as for Figure 1e. (f, g) Relative transcript levels of AOS and VSP2 in A. thaliana treated with 1 and diyne-tagged 1s. Quantitative RT-PCR analyses of relative transcript levels were performed after treatment with each 1 derivative. “Cont.” indicates the mean AOS or VSP2 transcript level under control conditions. Bars represent the mean AOS or VSP2 transcript level of test samples (100 μM). Bars represent mean and SE (n = 3). Letters a–c indicate significant differences between the means (ANOVA: P < 0.05).
