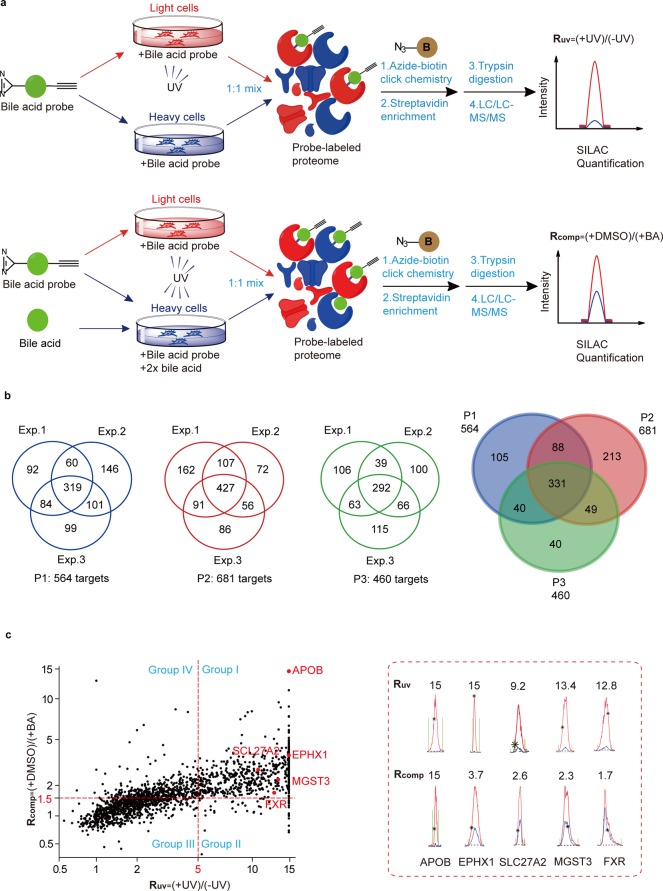
Figure 2.
MS-based profiling of BA-interacting proteins in living cells by ABPP-SILAC. (a) Scheme for ABPP-SILAC experiments in which UV-dependent labeling and competition by 2× natural BA are quantified, respectively. (b) Venn diagrams showing the number of BA-interacting proteins identified specifically with each BA probe and commonly with all three probes. (c) Representative SILAC ratio plot for all BA-interacting proteins identified with P2. The x-axis is the SILAC ratio quantified in the UV-dependent labeling experiment. The y-axis is the SILAC ratio quantified in the BA-competition experiment. Select examples of known BA-interacting proteins are colored in red, and their extracted ion chromatograms are shown on the right.

