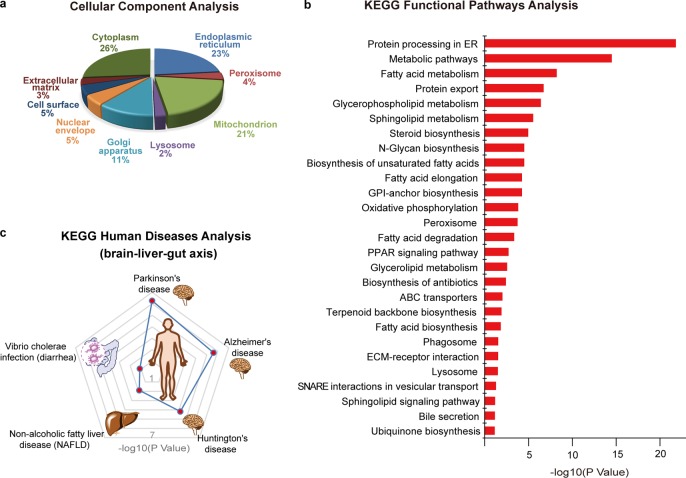
Figure 3.
Bioinformatic analysis of BA-interacting proteins. (a). Cellular component analysis of BA-interacting proteins by gene ontology (GO). (b) Functional pathways analysis of BA-interacting proteins by Kyoto Encyclopedia of Genes and Genomes (KEGG). The enriched pathways are ranked based on their P values. (c) Human diseases analysis of BA-interacting proteins by KEGG. The top 5 enriched disease pathways are shown, and their P values are marked with red dots on the contour plot.

