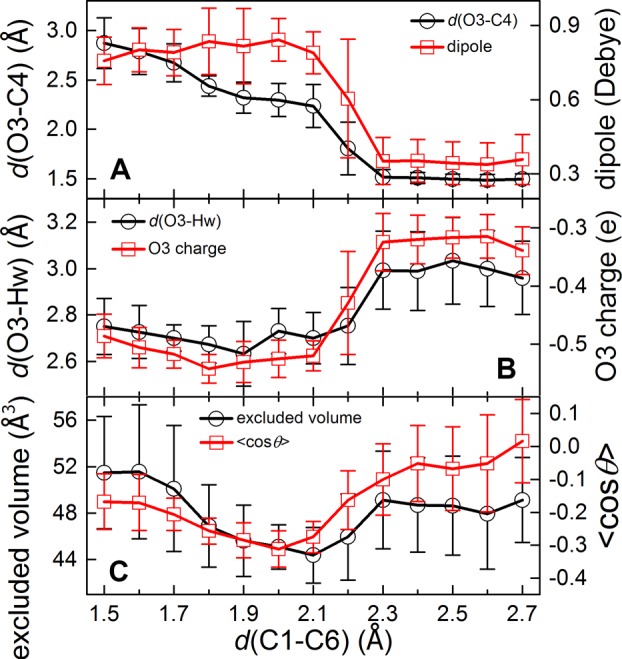
Figure 3.

Dynamic changes of intramolecular properties and solute–solvent interactions along the reaction progression (d(C1–C6)). (A) O3–C4 distance d(O3–C4) (black) and molecular dipole (red) of the reactant; (B) the negative charge on O3 atom (red) and the hydrogen bond length (d(O3–Hw) (black); (C) the solvent-excluded volume (black) and the dipole orientation of the solvation shell codθ (red, see the definition in the Supporting Information, Text section V).
